Projects & Site Management
A Project is a container for one website and every page DefiniteSEO scans for it. Projects let you organize the sites you manage, keep each site’s scores and reports together, and track SEO over time, so you can re-run audits whenever you publish changes and watch the numbers move.
This guide covers your Projects dashboard and the metrics on each project card, how to create a project, and how to read the Site Report section by section, from analyzed pages to the visible links, sitemap pages, and unlisted pages DefiniteSEO discovers for the site.
On this page
- 1. Open your Projects dashboard
- 2. Read a project card
- 3. Create a new project
- 4. Name your project and add the website
- 5. Open a project's Site Report
- 6. Read the Site Report stats bar
- 7. Refresh, view, or download the report
- 8. Review the Analyzed Pages and discovery sections
- 9. Scan many pages with a Sequential Scan
Open your Projects dashboard
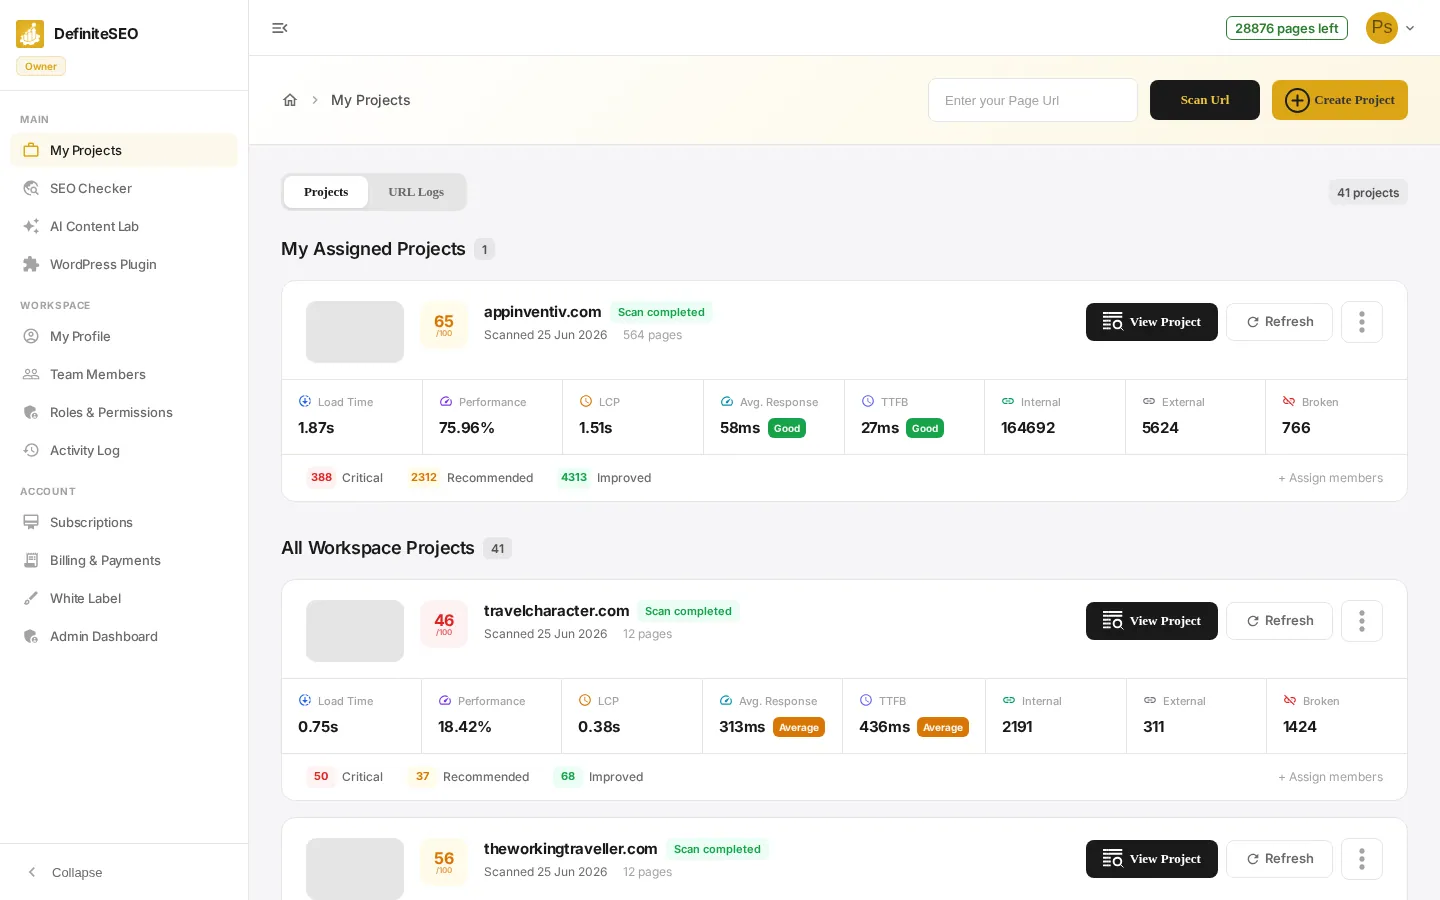
Your Projects dashboard lists every site you manage as a card. Use the Projects and URL Logs toggle at the top to switch between your projects and a flat log of individually scanned URLs, and use the Scan Url box in the header to audit a single page without creating a project. A count chip shows how many projects you have.
📝 Note These screens require you to be signed in. If you are not logged in, the dashboard will prompt you to sign in first.
Read a project card
Each project is shown as a card so you can scan its health at a glance before opening it. The card has four parts: a header with the site’s screenshot, score, and title; a row of performance and link metrics; an issue summary; and, in a workspace, the members assigned to the project. Here is what every element on the card tells you:
- Screenshot and title: A homepage thumbnail and the project title you chose. A placeholder image is shown until the first scan captures a screenshot.
- Score badge: The project's overall SEO score out of 100, color-coded green for strong, orange for needs-improvement, and red for weak.
- Scan status and pages: A status pill (for example Scan completed), the date the site was last scanned (or Not scanned yet), and the total number of pages in the project.
- Load Time: How long the homepage took to fully load, shown in seconds.
See 6 more checks
- Performance: The site's performance score as a percentage, drawn from the Lighthouse scan.
- LCP: Largest Contentful Paint, the time in seconds until the largest visible element loads. A Core Web Vital.
- Avg. Response: Average server response time in milliseconds, rated Good, Average, or Poor.
- TTFB: Time to first byte in milliseconds, how quickly the server starts replying, rated Good, Average, or Poor.
- Internal, External, and Broken: The number of internal links, external links, and broken links discovered across the site.
- Critical, Recommended, Improved: A count of issues in each severity band: red Critical needs attention first, orange Recommended is worth fixing, and green Improved is already in good shape.
💡 Tip In a workspace the dashboard splits projects into My Assigned Projects and All Workspace Projects, and owners and admins can assign members to a project from the avatar group on the card.
Create a new project
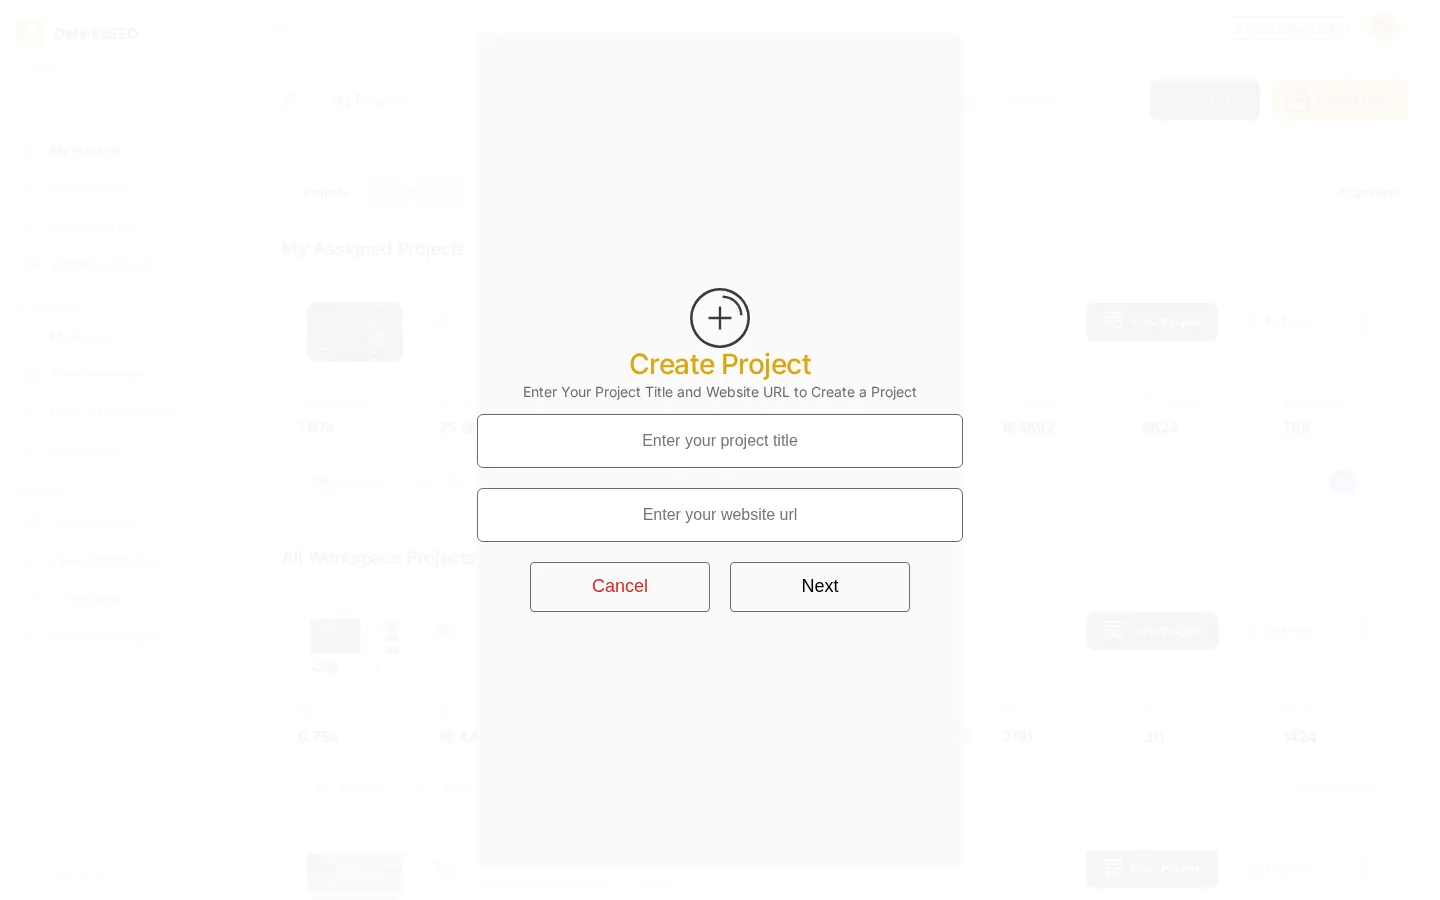
Click Create Project to open the new-project dialog. A project is a container for one website and all of its scanned pages and reports.
Name your project and add the website
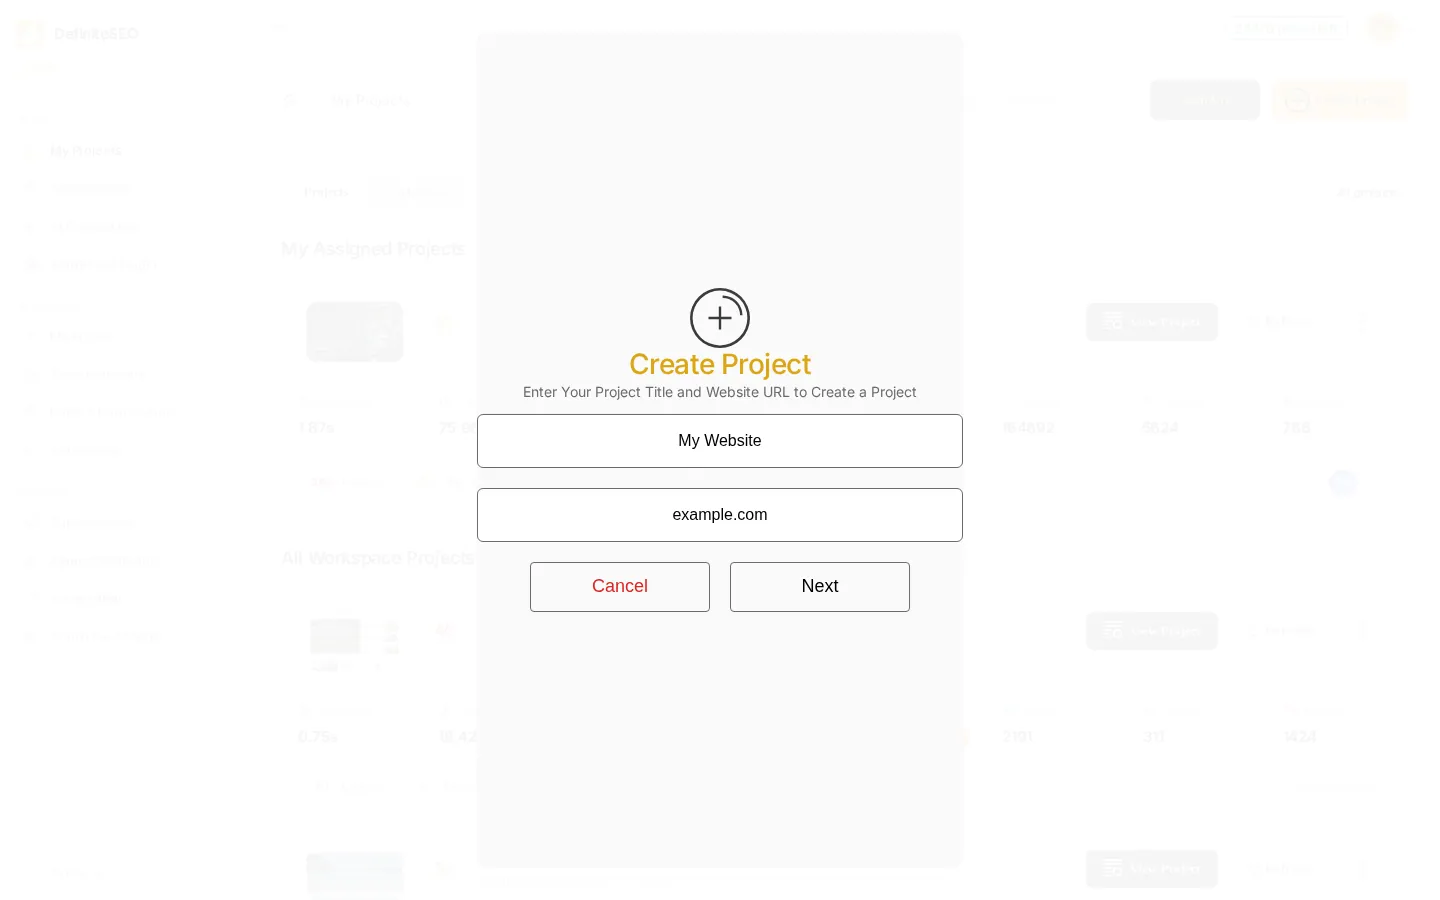
Enter a recognizable Project Title and the Website URL, then click Next. Both fields are required and the URL must be a valid web address; otherwise the dialog shows an inline error. DefiniteSEO then sets up the project, shows a Creating Your Project progress screen, runs the first scan, and opens the new project’s Site Report.
💡 Tip Use a name you'll recognize at a glance – like the brand or domain – especially once you manage several sites.
Open a project's Site Report
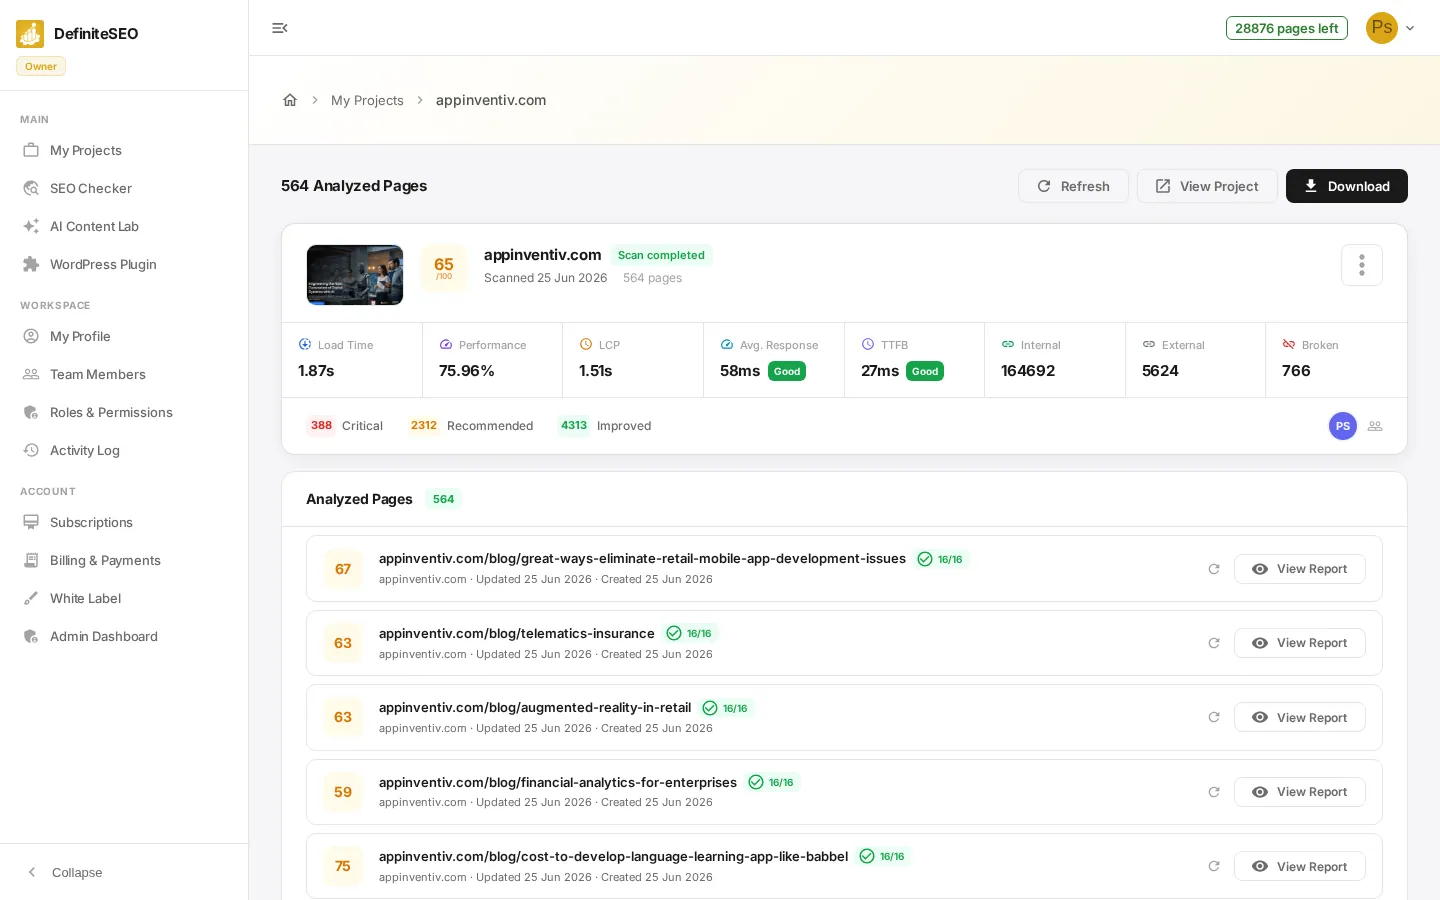
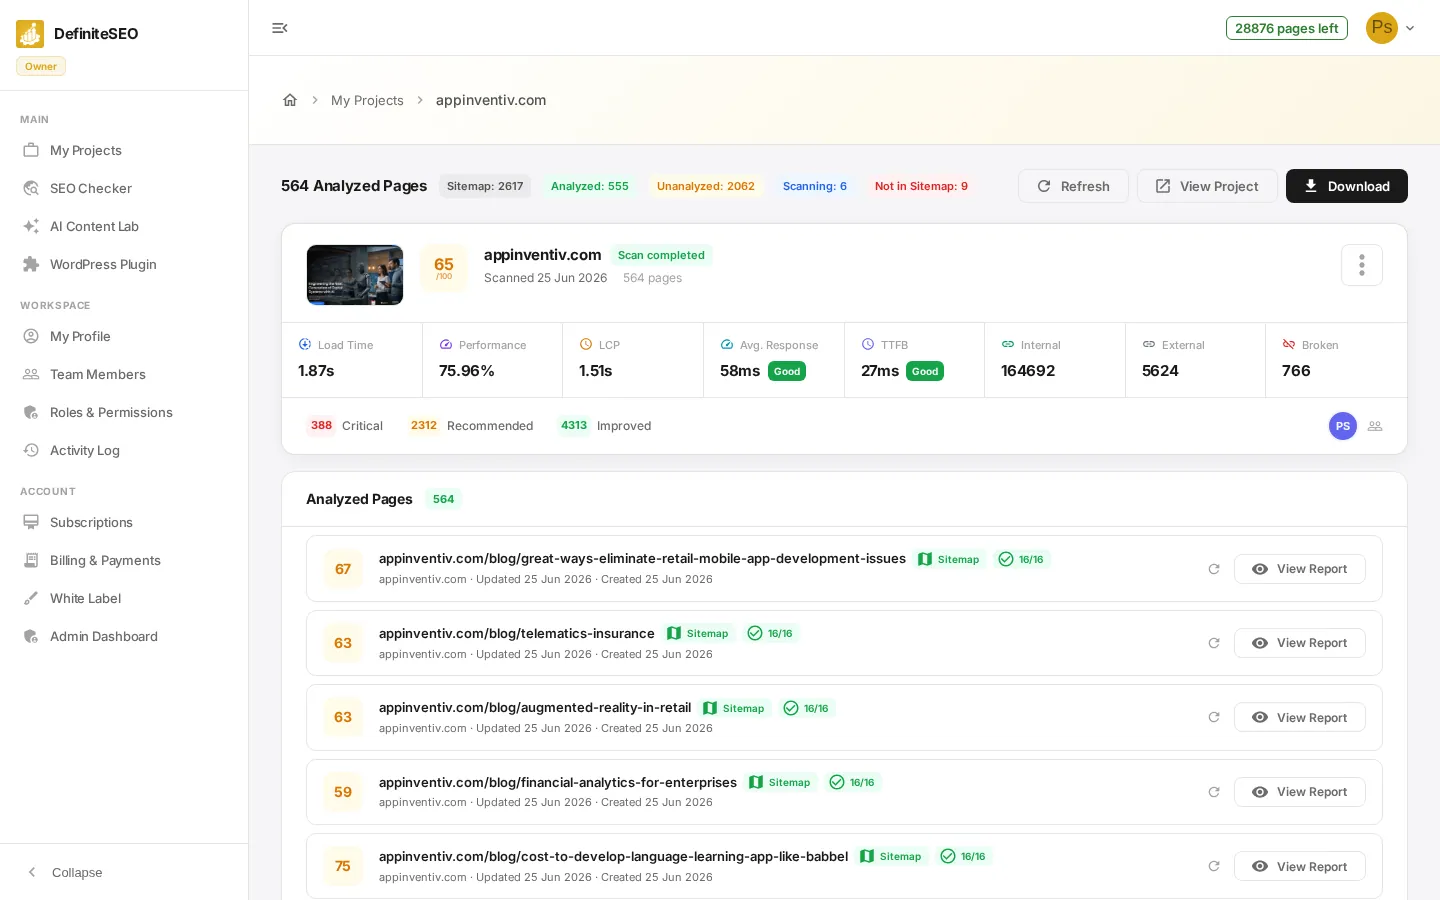
On a project card, click View Project to open its Site Report. The report opens with a stats bar, the same project overview card you saw on the dashboard, and then a series of sections: Analyzed Pages, Visible Links, Internal Links, Unanalyzed Pages, and Not in Sitemap. Together they show what has been scanned and what is left to scan for the site.
💡 Tip Use the Visible Links and Unanalyzed Pages sections to analyze more of the site – select pages and click Analyze to scan them in batches.
Read the Site Report stats bar
The bar at the top of the Site Report summarizes coverage for the whole site. The bold number is your total analyzed pages, followed by color-coded chips that appear as they apply. Here is what each chip means:
- Analyzed Pages count: The headline total of pages that have been scanned for this project.
- Sitemap: How many pages were found in the site's sitemap. If no sitemap is reachable, a red No sitemap chip is shown instead.
- Analyzed: A green chip counting how many sitemap pages have already been scanned.
- Unanalyzed: An orange chip counting sitemap pages not yet scanned.
See 2 more checks
- Queued and Scanning: How many pages are waiting in a sequential scan queue and how many are being scanned right now.
- Not in Sitemap: A red chip counting pages that were analyzed but are missing from your sitemap.
📝 Note If a sitemap is very large, only the first pages are listed and an info banner tells you the cap. The Sitemap chip shows a plus sign when the count is capped.
Refresh, view, or download the report
The buttons on the right of the stats bar act on the whole project. Click Refresh to re-pull the latest scan status, View Project to open the complete website report in a new tab, or Download to save a shareable HTML report of every analyzed page. Re-run scans whenever you ship changes to keep scores current.
📝 Note Downloading and exporting reports may depend on your plan and role. White-label accounts can brand the downloaded report with their own logo and domain.
Review the Analyzed Pages and discovery sections
Below the overview card, the report lists every page it knows about, grouped so you can see what is done and what to scan next. Each section can be paged through, and selecting pages lets you scan them in batches. Here is what each section does:
- Analyzed Pages: Every page that has been scanned, each row showing its score, badges for whether it is in your Sitemap, on your Homepage, or a Visible link, a passing-factor count, and a View Report button to open the full report.
- Visible Links: Links a real visitor can see on the rendered homepage (hidden menus and collapsed dropdowns are excluded). Tick the ones you want and analyze them, or use Recheck to refresh the list.
- Internal Links: Internal links discovered on the homepage that have not been analyzed yet, ready to be selected and scanned.
- Unanalyzed Pages: Pages found in your sitemap that have not been scanned yet, listed with a from Sitemap label so you can fill in coverage.
See 2 more checks
- Not in Sitemap: Pages that have been analyzed but are missing from your sitemap. Consider adding them to your sitemap for better discovery, and open each one's report from here.
- Analyze in batches: Select pages with their checkboxes (up to 50 at a time) and use Analyze to scan a batch, or use the per-row Analyze button to scan a single page.
💡 Tip When every page in a section is scanned, DefiniteSEO replaces the list with a green All … are analyzed confirmation, so an empty section means you are fully covered.
Scan many pages with a Sequential Scan
To audit a lot of pages without overloading the site, the discovery sections include a Sequential Scan tool that scans one page at a time on DefiniteSEO’s servers. Pick how many of the top unanalyzed pages to scan (or use your selection), choose a minimum delay between pages, then click Scan one by one. A live tracker shows progress and lets you cancel.
- Pages to scan: Choose a preset of 10, 20, 30, 40, or 50 of the top unanalyzed pages, or type a custom number (maximum 50). If you have selected specific pages, those are scanned instead.
- Minimum delay between pages: Pick None, 30s, 60s, or 120s (or a custom value up to 600 seconds) to space out requests and stay bot-safe. Actual granularity is about one minute on the server.
- Runs on our servers: The scan continues even if you close the tab. Only one sequential scan runs per project at a time, so the Start button is disabled while a job is already running.
⭐ Important Pages that are already analyzed or in progress are skipped automatically, so you never double-scan or waste page credits.