SEO Checker – Analyze Any Page in Seconds
The SEO Checker is a free tool that audits any web page and grades it across 15+ categories – on-page factors, content, keywords, links, images, video, performance, security, accessibility, usability, domain & networking, and AI visibility. Enter a URL and DefiniteSEO runs a live scan, streaming each category’s score and findings into an easy-to-read report.
This guide walks through every screen and element you will touch: the search box and device toggle, the live scan, the colored score dial, the AI Visibility card, the Critical / Recommended / Improved breakdown, the per-category bars, the left sidebar, the report toolbar, and the individual checks inside each section, including the newer AI Visibility and Agentic Browsing areas.
On this page
- 1. Open the SEO Checker
- 2. Enter the page and pick a device
- 3. Run the analysis
- 4. Get oriented: the report toolbar
- 5. Review your overall SEO score
- 6. Read the left sidebar
- 7. Inspect on-page factors (Common SEO)
- 8. Check your content quality
- 9. Check page performance
- 10. See your AI Visibility
- 11. Review Agentic Browsing readiness
- 12. Save, share, or re-run your report
Open the SEO Checker
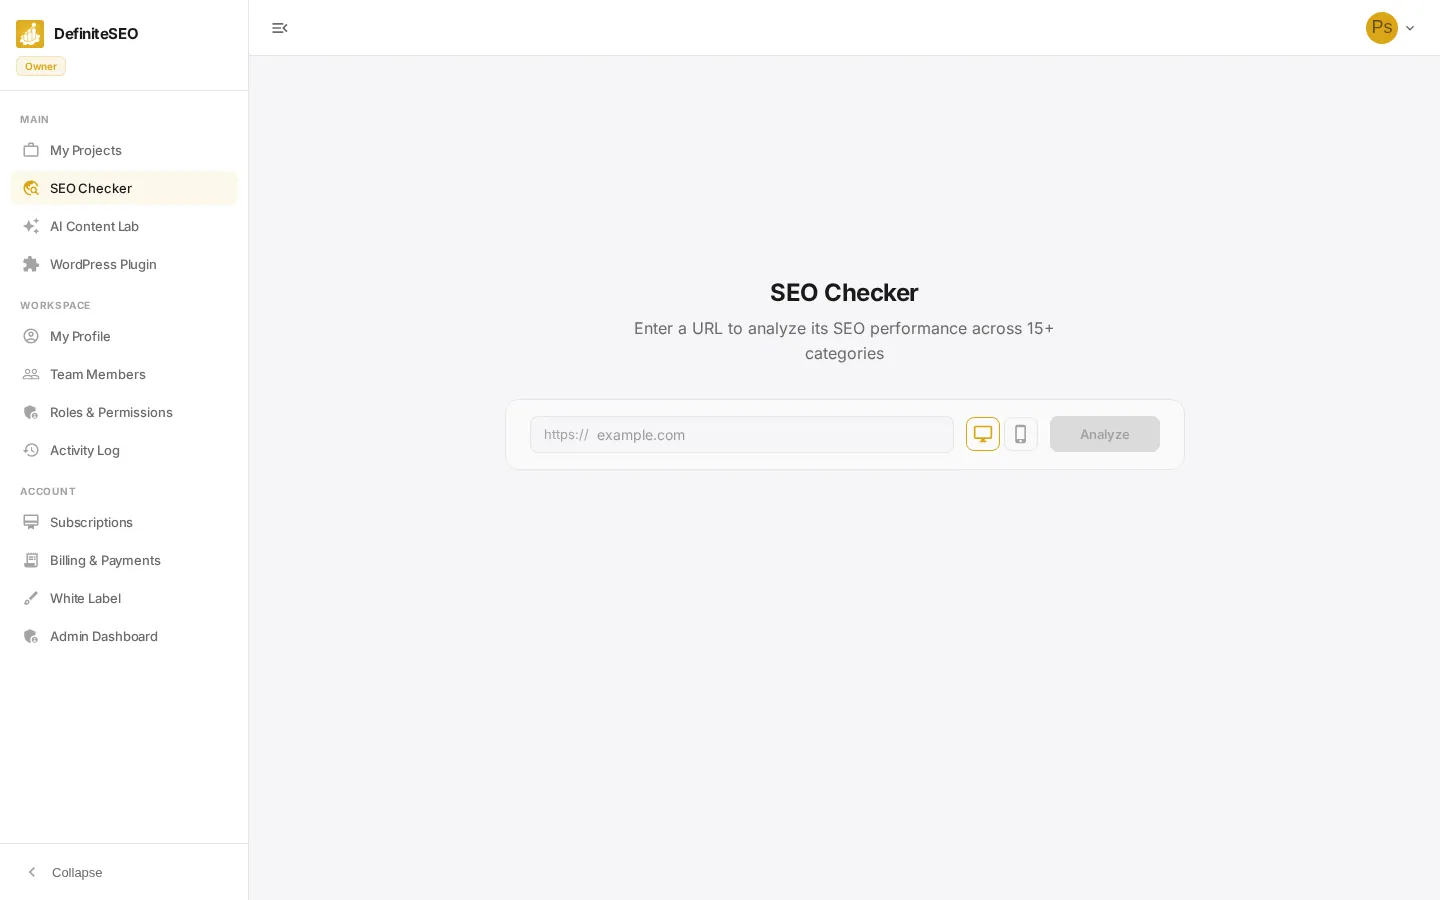
Head to the SEO Checker page from the dashboard sidebar (under Main). You land on a centered card titled SEO Checker with the line Enter a URL to analyze its SEO performance across 15+ categories. Below it is a single search box where you can paste the address of any page you want to audit. No account is required to get started.
- URL box: A single text field with a fixed https:// prefix shown inside it on the left and the placeholder example.com. You only type the domain or path; the prefix is added for you.
- Desktop and Mobile icons: Two square toggle buttons to the right of the box, a monitor icon and a phone icon. The selected one is highlighted in the brand gold; Desktop is selected by default.
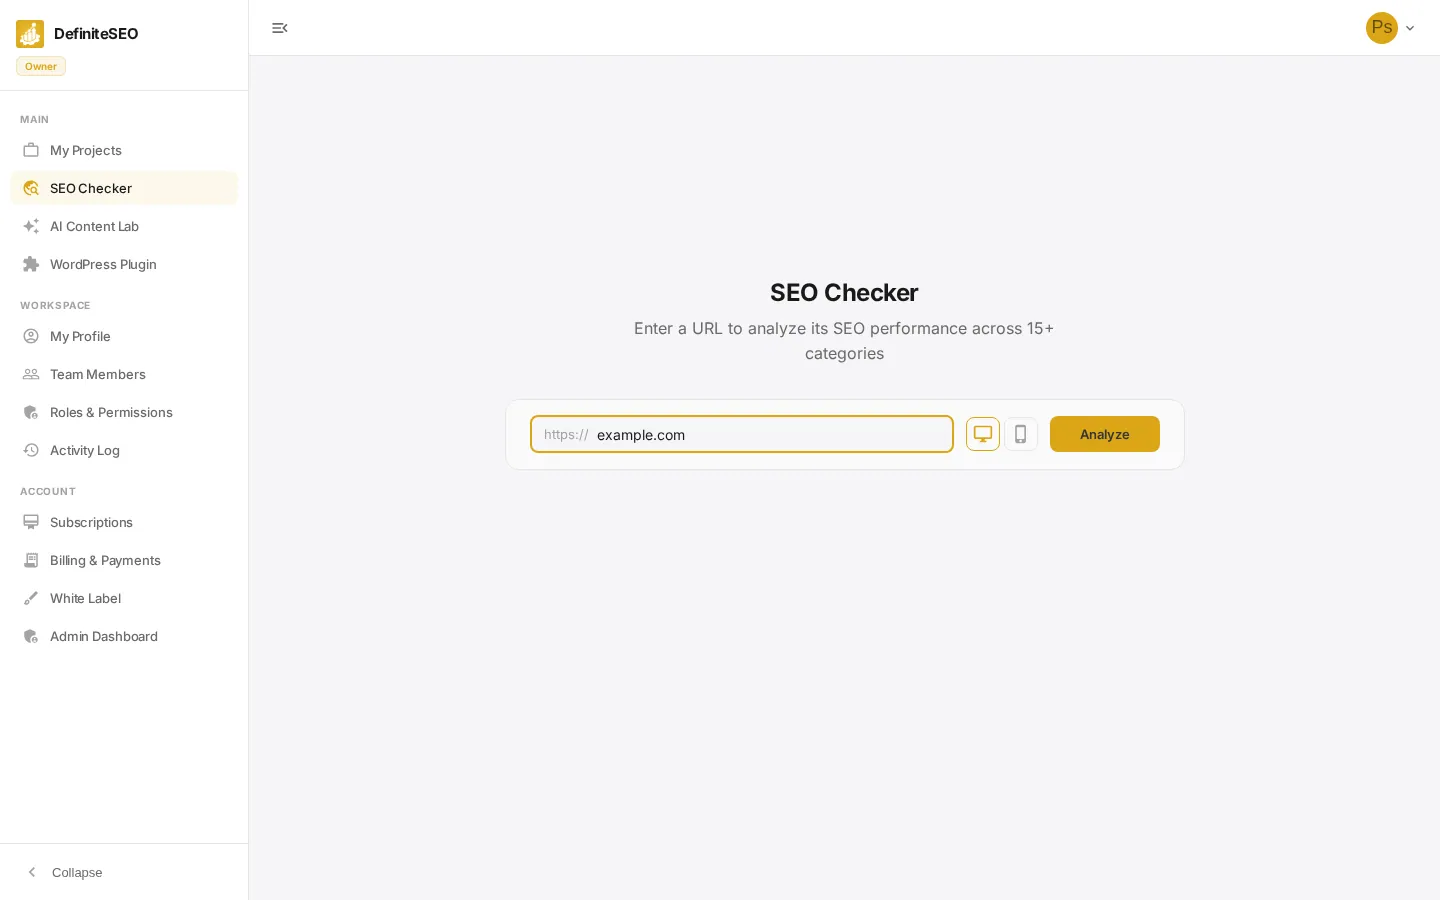
- Analyze button: The gold action button at the far right. It stays disabled (greyed out) until you enter a valid-looking URL, then turns gold and clickable. Pressing Enter in the box does the same thing.
📝 Note Guests get a handful of free scans. Sign up free to remove limits and save every report to your dashboard.
Enter the page and pick a device
In the URL box, type or paste the page you want to check (for example, type example.com after the https:// prefix). Use the Desktop and Mobile icons beside the box to choose which version to audit. As soon as the URL looks valid, the Analyze button turns gold and becomes clickable. Mobile results reflect how Google sees your site on phones.
- Desktop view: Audits the full desktop rendering of the page. This is the default and is best when your traffic is mostly desktop.
- Mobile view: Audits the mobile rendering instead. Because Google indexes mobile-first, this is the version most pages should optimize for.
- What makes a URL valid: Any domain with a real extension works, with or without https:// and with or without a path (for example example.com, https://example.com, or example.com/blog). Until the text matches that shape, Analyze stays disabled.
Run the analysis
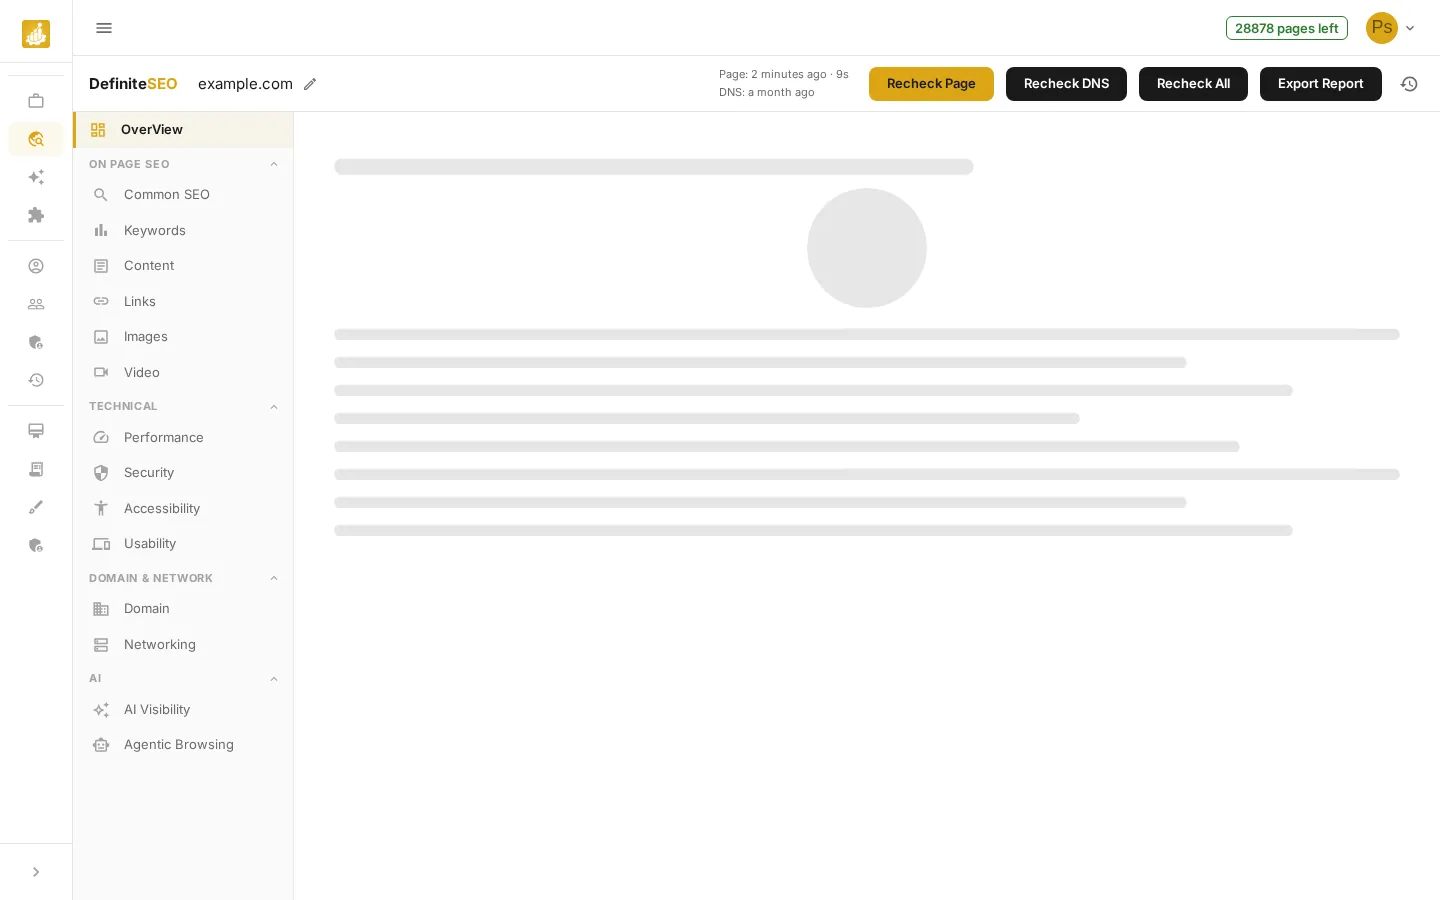
Click Analyze. The report opens at /seo-checker/report and a live scan begins, evaluating the page category by category. While it works, the Analyze button shows a spinner and the report area shows shimmering placeholders. Scores populate in real time in the left sidebar as each check completes.
💡 Tip The scan streams results progressively – you can start reading the first categories while the rest finish loading. Sidebar items show a small spinner until that category's score arrives.
Get oriented: the report toolbar
Once the report opens, a toolbar runs across the top and stays visible in every section. From left to right it shows your branding, the analyzed URL, when the page and DNS were last scanned, and the action buttons. Here is what each part does:
- Brand logo and URL: The DefiniteSEO (or your white-label) logo, then the analyzed URL. A small pencil icon next to the URL takes you back to the search box to edit and re-run a different address.
- Page and DNS timestamps: Two lines reading, for example, Page: 2 minutes ago and DNS: a month ago, each with the scan duration in seconds when available. They tell you how fresh each part of the report is. Page and DNS are scanned separately, so their ages can differ.
- Recheck Page (gold): Re-runs the on-page and performance scan only. Use it after you publish content or speed fixes. It is disabled while a scan is already running.
- Recheck DNS (dark): Re-runs only the domain and network checks (DNS records, mail authentication, network security). These change rarely, so you rarely need it.
See 3 more checks
- Recheck All (dark): Re-runs everything, page plus DNS, in one pass.
- Export Report (dark): Opens the export dialog to download an HTML copy, copy a shareable link, or email the report.
- Pages-left chip: In the top header, a chip such as 28878 pages left shows your remaining scan quota for the workspace or guest session.
📝 Note The Recheck and Export buttons appear when you are signed in. Guests can run a scan but need a free account to recheck, export, or share. On narrow screens these actions collapse into a single overflow (three-dot) menu.
Review your overall SEO score
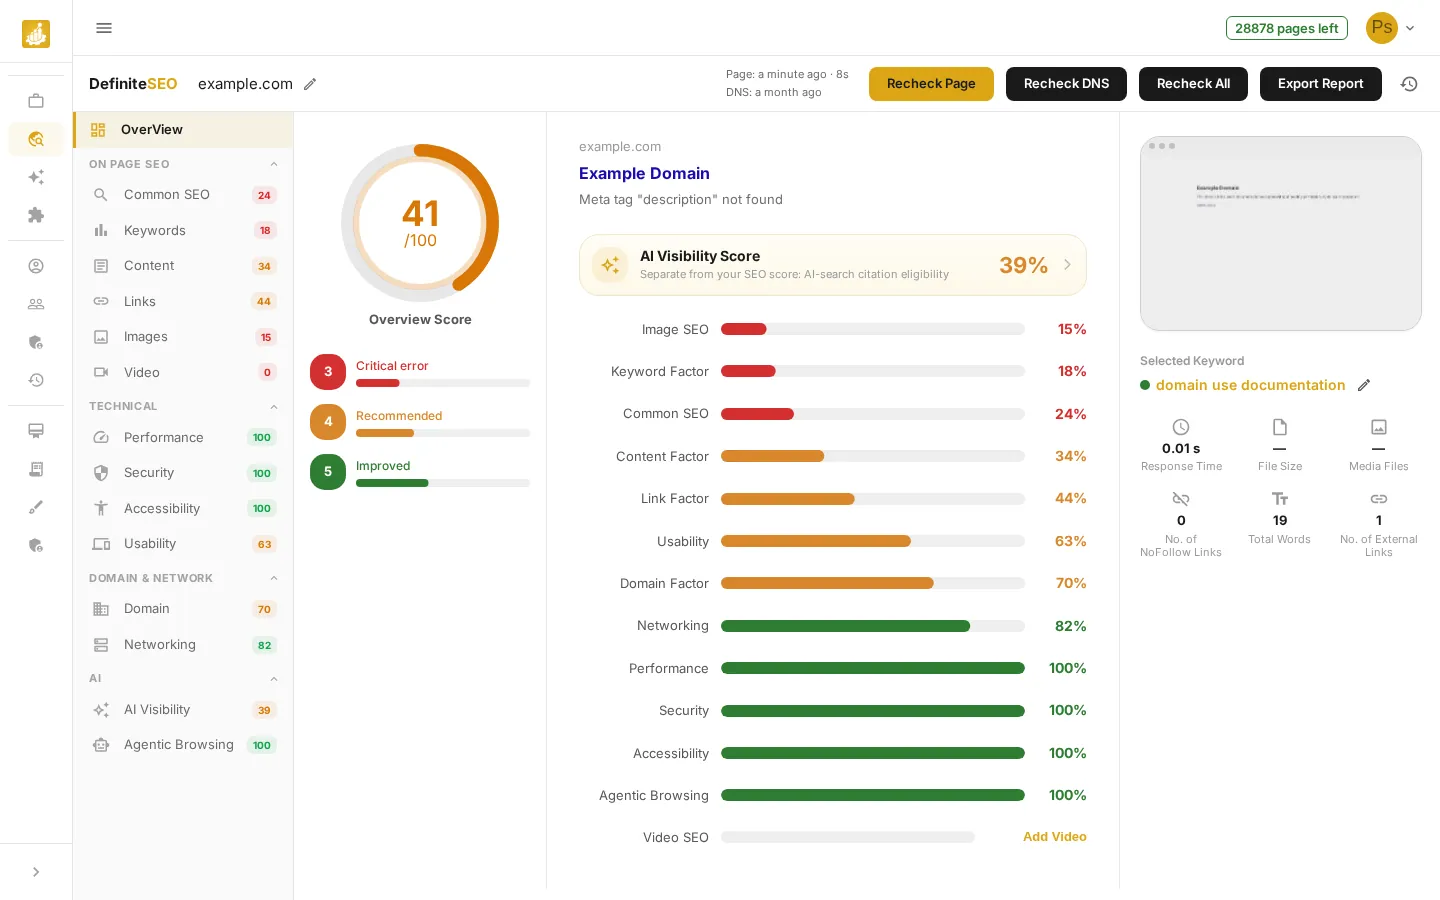
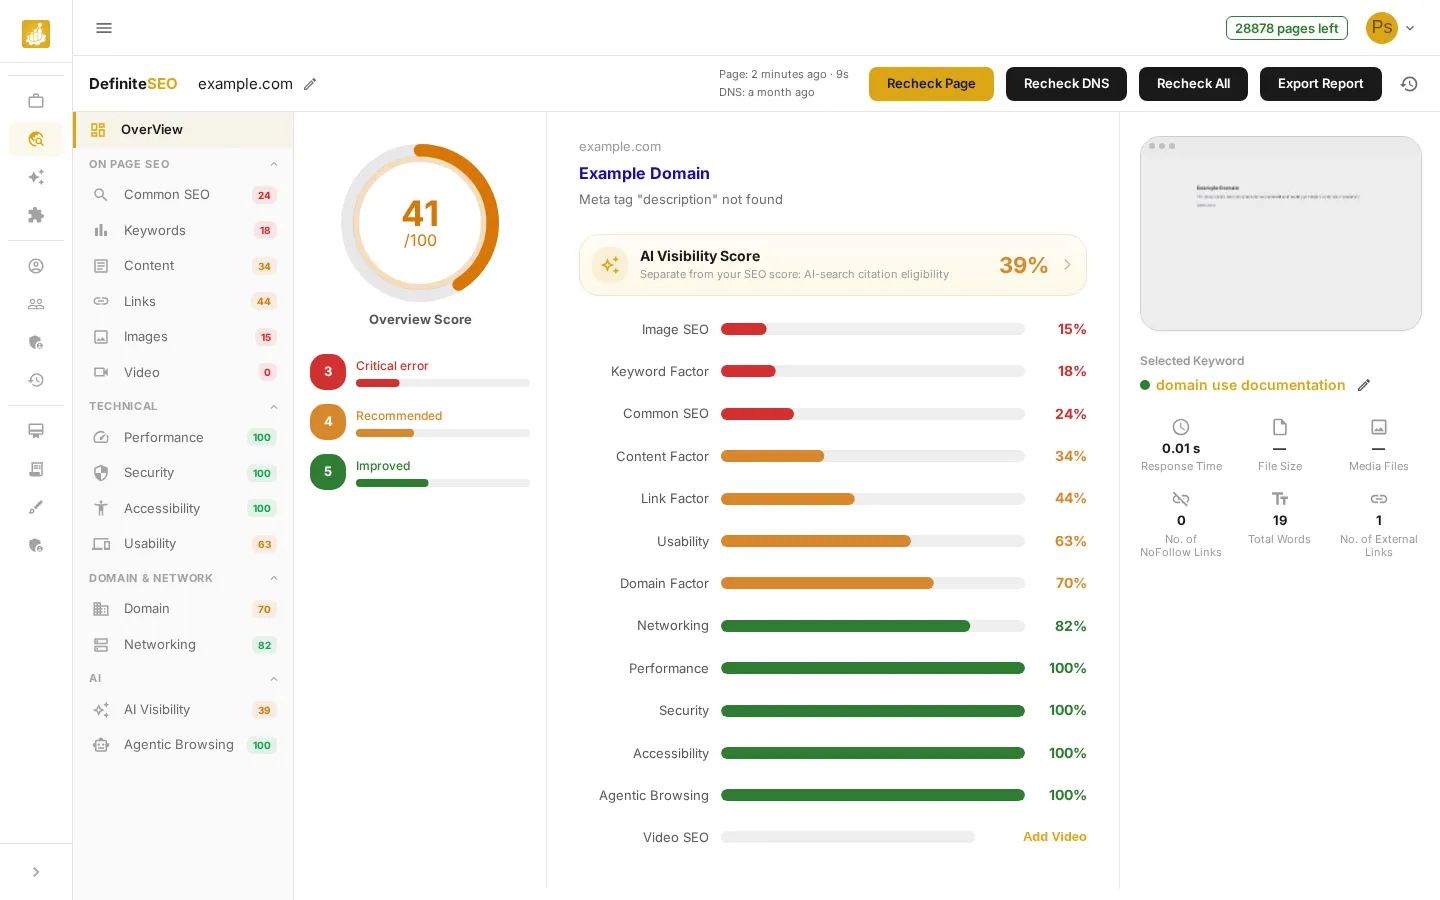
When the scan finishes, the OverView shows your results in three columns. On the left is a large colored dial reading Overview Score out of 100, with a Critical error / Recommended / Improved breakdown beneath it. The middle column lists every category as a colored bar. The right column shows a page screenshot, the selected keyword, and key page stats. Select any category in the sidebar to open its full detail.
- Overview Score dial: The big ring labeled Overview Score shows your overall score out of 100. The arc and number are green above 70, orange (amber) between 30 and 70, and red at 30 or below, a weighted blend of every category.
- Critical error count (red): A red tile with a number and a progress bar counting how many categories scored 30 or below. These are your most urgent fixes.
- Recommended count (orange): An orange tile counting categories scoring between 30 and 70: worth improving but not critical.
- Improved count (green): A green tile counting categories scoring above 70, the ones already in good shape.
See 4 more checks
- AI Visibility Score card: A highlighted gold-tinted card reading AI Visibility Score with the subtitle Separate from your SEO score: AI-search citation eligibility, a percentage, and an arrow. Click it to jump to the AI Visibility section. This score is deliberately NOT part of the overall SEO score.
- Category bars: Each category (Image SEO, Keyword Factor, Common SEO, Content Factor, Link Factor, Usability, Domain Factor, Networking, Performance, Security, Accessibility, Agentic Browsing, Video SEO) is a horizontal bar with its percentage, sorted weakest-first. Bars are color-coded by the same green/orange/red thresholds. Click any bar to open that section.
- N/A and Add links: Categories with no data show a grey bar marked N/A. Keyword Factor with no keyword shows an Add Keyword link and Video SEO with no video shows an Add Video link instead of a score.
- Page preview and stats: The right column shows a browser-framed screenshot of the page, the Selected Keyword (with a pencil to change it), and six stat tiles: Response Time, File Size, Media Files, No. of NoFollow Links, Total Words, and No. of External Links.
⭐ Important Your AI Visibility Score is shown separately and is NOT part of the overall SEO score – it measures how likely AI assistants are to cite your page.
Read the left sidebar
The left sidebar is how you move around the report. OverView sits at the top, followed by four collapsible groups: On Page SEO, Technical, Domain & Network, and AI. Each category row shows an icon, its name, and a small colored score chip so you can spot weak areas at a glance. The active section is highlighted with a gold left-edge bar.
- On Page SEO group: Holds Common SEO, Keywords, Content, Links, Images, and Video, the on-page signals you directly control in your page markup and copy.
- Technical group: Holds Performance, Security, Accessibility, and Usability, the engineering-side health of the page.
- Domain & Network group: Holds Domain and Networking, the foundations behind the page: registration signals plus DNS and network security.
- AI group: Holds AI Visibility and Agentic Browsing, how AI search engines and AI agents see and act on your page.
See 2 more checks
- Score chips: Each row shows a rounded score chip tinted to its severity (green/orange/red). While a category is still scanning, a small spinner shows in place of the chip until its score arrives.
- Collapse and active state: Click a group header to collapse or expand it. The section you are viewing gets a gold left border and bold label so you always know where you are.
Inspect on-page factors (Common SEO)
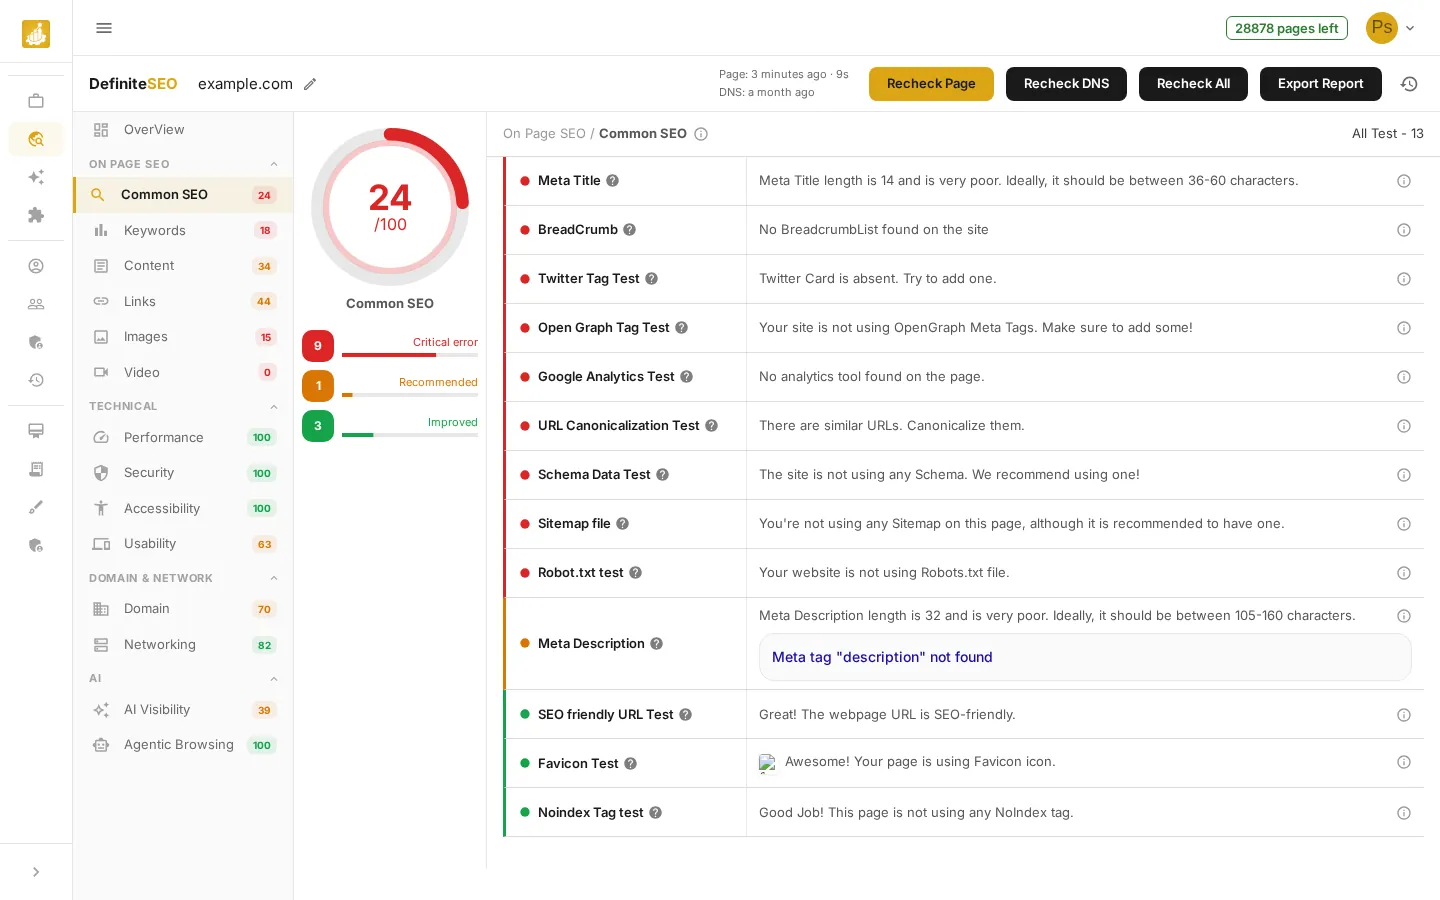
In the sidebar, click Common SEO to review the fundamental on-page signals such as the title tag, meta description, headings, canonical, and structured data. The section opens with a category score dial and its own Critical error / Recommended / Improved tiles on the left, a breadcrumb (On Page SEO / Common SEO) and an All Test count at the top, and one row per check. Each row has a colored status dot, the check name (with a ? help icon), the result message, and an info (i) icon with how-to-fix guidance.
- Status dot (red / orange / green): The colored dot at the start of each row is the check's severity: red is critical, orange is a recommendation, green is passing. Rows are sorted with the most urgent first.
- ? help icon and (i) info icon: The ? next to a check name explains what the check is. The (i) at the end of the result message explains how to fix it. Both are also keyboard-reachable.
- Meta Title: Checks your page has a title tag of a good length (about 51-60 characters). It is what users see in search results and strongly affects clicks.
- Meta Description: Checks for a clear page summary (about 105-160 characters), which forms the snippet shown under your title in search results.
See 11 more checks
- BreadCrumb: Looks for breadcrumb navigation, which helps visitors and search engines understand where a page sits in your site.
- SEO Friendly URL: Checks the URL is clean and descriptive, so it is easy for search engines and people to read.
- Twitter Tag: Looks for Twitter Card tags that control how your link looks when shared on X (Twitter).
- Favicon: Checks for a site icon, which builds brand recognition in browser tabs, bookmarks, and search. When present, the favicon image is shown inline in the result.
- Open Graph Tags: Looks for Open Graph tags that control how your link previews on Facebook, LinkedIn, and other platforms.
- Noindex Tag: Detects a noindex tag that blocks the page from search results, which is useful on purpose but harmful by accident.
- Google Analytics: Checks for an analytics tag so you can measure traffic and improve the page over time.
- URL Canonicalization: Checks for a canonical tag, which prevents duplicate-content confusion and consolidates ranking signals.
- Schema Data: Looks for structured data (JSON-LD) that can unlock rich results and helps engines understand your page.
- Sitemap: Checks for an XML sitemap, which helps search engines discover all of your important pages.
- Robots.txt: Checks for a robots.txt file, which tells crawlers which parts of your site they may access.
Check your content quality
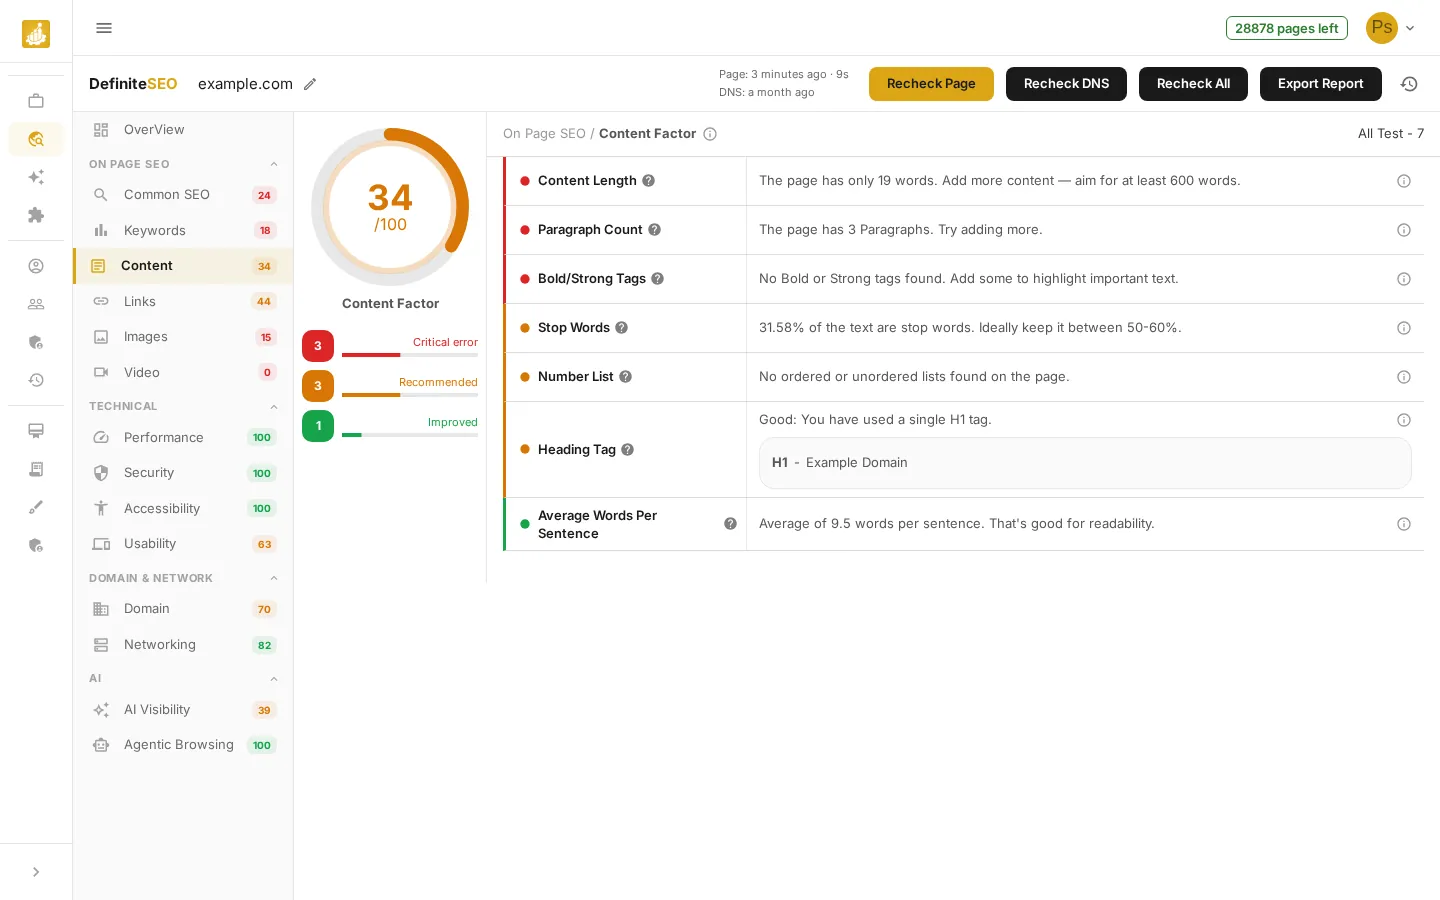
Click Content to evaluate the depth and readability of your copy, including word count, heading structure, and keyword usage. This shows whether the page gives search engines enough to work with. As with every section, the left dial scores the category and each row scores one check; some checks expand to show extra detail (for example the Heading Tag row lists your H1 text).
- Content Length: Measures total word count, since in-depth content tends to rank better and hold attention.
- Paragraph Count: Checks the page is broken into enough paragraphs for comfortable reading.
- Stop Words: Checks the balance of common filler words (around 50-60 percent is natural), so content reads well without over-optimizing.
- Bold and Strong Tags: Looks for emphasized text that highlights key phrases and improves scannability.
See 3 more checks
- Average Words Per Sentence: Checks sentence length (about 14-20 words is ideal) for easy reading.
- Lists: Counts ordered and unordered lists, which break information into digestible chunks.
- Heading Tags: Checks for a clear H1 to H6 heading structure that organizes content for readers and engines. The row expands to show the detected H1 text so you can confirm it.
Check page performance
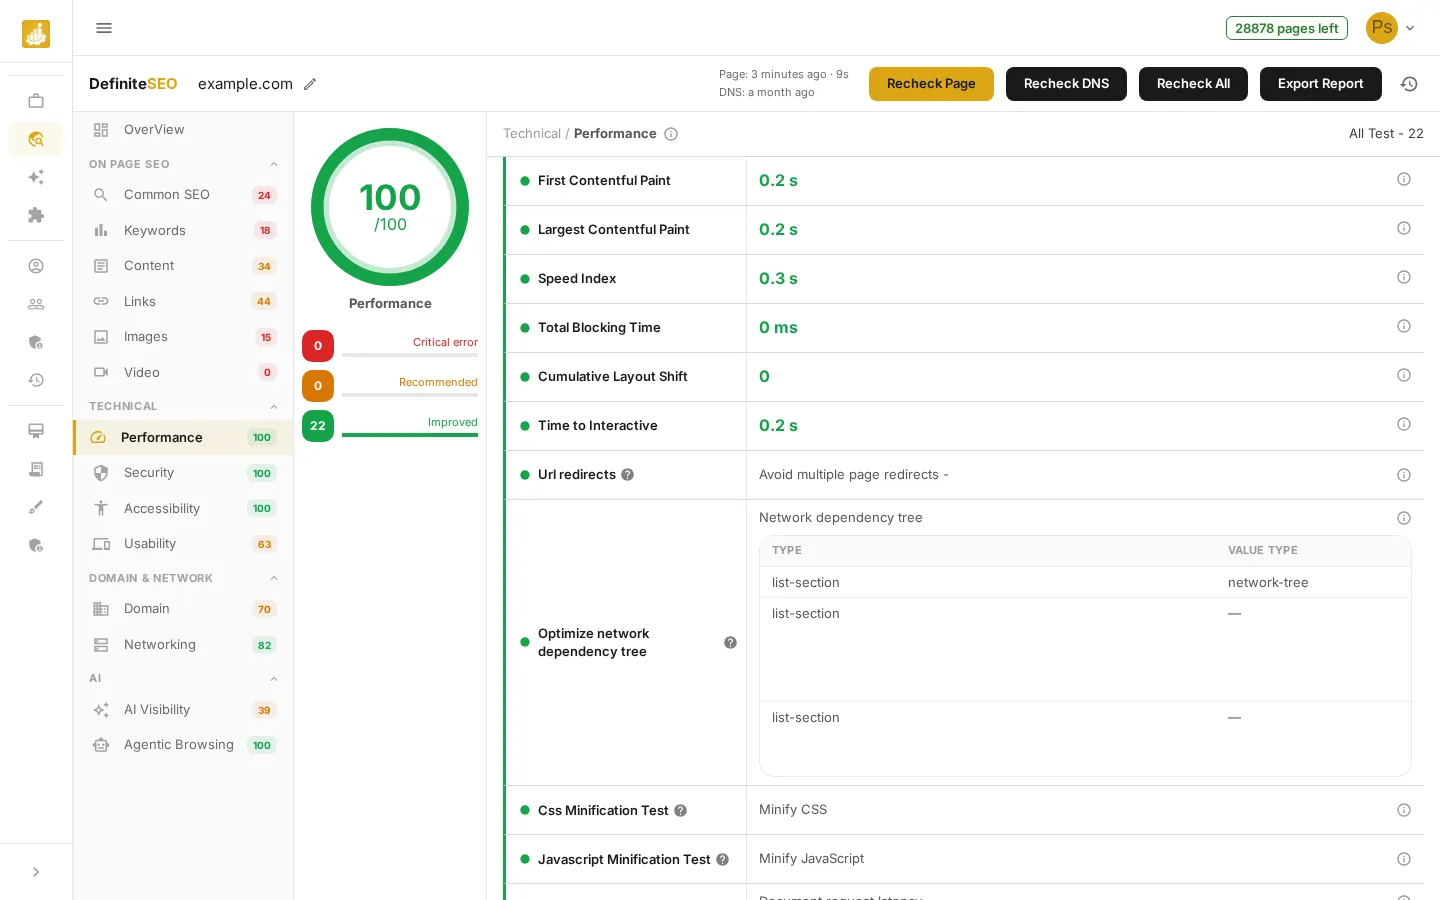
Click Performance to see load speed and Core Web Vitals from a Lighthouse scan. The Core Web Vital rows show their measured value (for example 0.2 s or 0 ms) as an emphasized colored number rather than a sentence, while diagnostic rows such as network or minification expand into small detail tables. The All Test count at the top is higher here because performance runs many audits.
- Largest Contentful Paint (LCP): Time until the largest visible element loads. A Core Web Vital that Google uses for ranking.
- Cumulative Layout Shift (CLS): How much the layout unexpectedly shifts while loading. A Core Web Vital for visual stability.
- Total Blocking Time (TBT): How long the page is blocked from responding to input. A Core Web Vital for interactivity.
- First Contentful Paint (FCP): Time until the first content appears, which shapes how fast the page feels.
See 10 more checks
- Speed Index: How quickly the page visibly fills in during load.
- Time to Interactive (TTI): When the page becomes fully usable for clicks and typing.
- Server Response Time: How quickly your server returns the first byte of the page.
- Render-Blocking Resources: Flags CSS and JavaScript that delay the first paint of the page.
- Unused CSS: Identifies stylesheet code the page never uses, which adds needless weight.
- Unused JavaScript: Identifies script code that loads but never runs, slowing the page down.
- Efficient Cache Policy: Checks static files are cached so repeat visits load faster.
- Image Delivery: Checks images are properly sized, compressed, and in modern formats.
- Total Page Size: Measures the combined weight of everything the page downloads.
- DOM Size: Counts page elements, since very large pages are slower to render.
See your AI Visibility
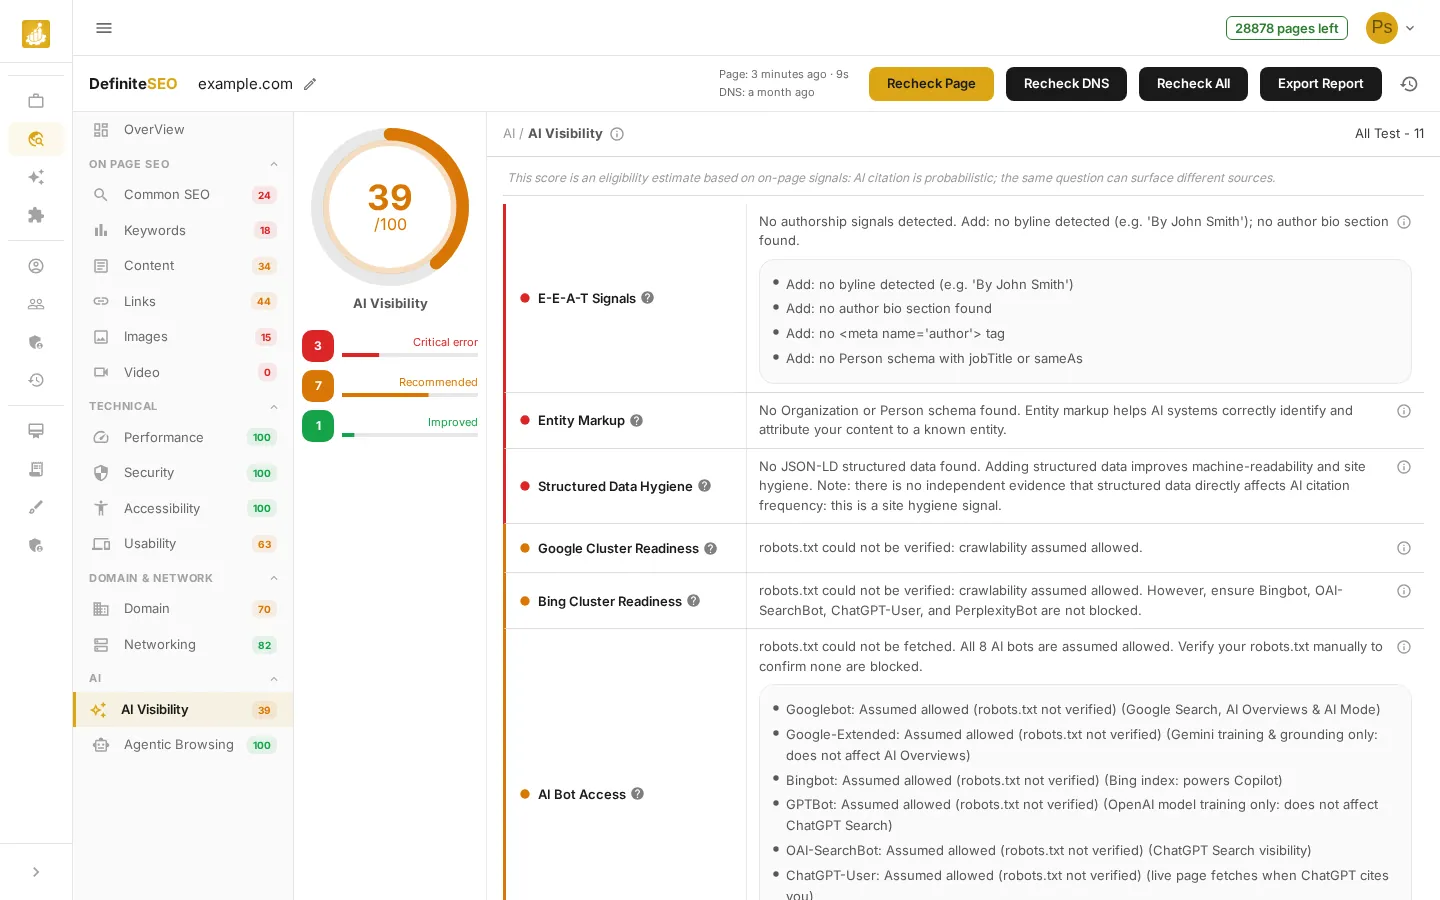
Click AI Visibility to see how likely your content is to be surfaced and cited by AI assistants and answer engines such as Google AI Overviews, ChatGPT Search, Bing Copilot, and Perplexity. A grey banner at the top reminds you that this score is an eligibility estimate based on on-page signals (AI citation is probabilistic; the same question can surface different sources). The section groups its checks into three areas: whether AI crawlers can reach you (retrievability), whether they can understand and quote you (extractability), and basic machine-readability (hygiene). Rows like E-E-A-T Signals and AI Bot Access expand into a bulleted to-do list or a per-bot breakdown.
- Google Cluster Readiness: Confirms Googlebot and Google-Extended are allowed in your robots.txt. This powers Google Search, AI Overviews, and AI Mode, so blocking it removes you from Google AI answers.
- Bing Cluster Readiness: Confirms the Bing and OpenAI family of crawlers (Bingbot, GPTBot, OAI-SearchBot, ChatGPT-User, PerplexityBot, ClaudeBot) can reach you. These feed Bing Copilot, ChatGPT Search, and Perplexity.
- AI Bot Access: A per-bot breakdown of which AI crawlers you allow or block, and whether each affects live search visibility or only model training. It lists each bot with its assumed or verified status.
- Content in Raw HTML: Checks your main content is in the initial HTML rather than loaded later by JavaScript, since many AI crawlers do not run scripts.
See 7 more checks
- Answer-First Structure: Looks for a clear summary near the top and focused sections, so an AI can lift a direct answer from your page.
- Statistics and Quotations: Rewards backing claims with concrete numbers and citing authoritative sources, which AI engines prefer to quote.
- Freshness: Checks how recently the page was updated, since AI answers favor current content.
- E-E-A-T Signals: Looks for signs of real expertise and expands into a checklist of what to add: an author byline, an author bio, an author meta tag, and Person schema.
- Entity Markup: Checks for Organization or Person structured data with sameAs links, so AI can correctly identify and attribute your content.
- Structured Data Hygiene: Verifies you use valid JSON-LD structured data for better machine-readability.
- llms.txt: Notes whether your site publishes an llms.txt file. This is informational only, with no proven impact on AI citations yet.
Review Agentic Browsing readiness
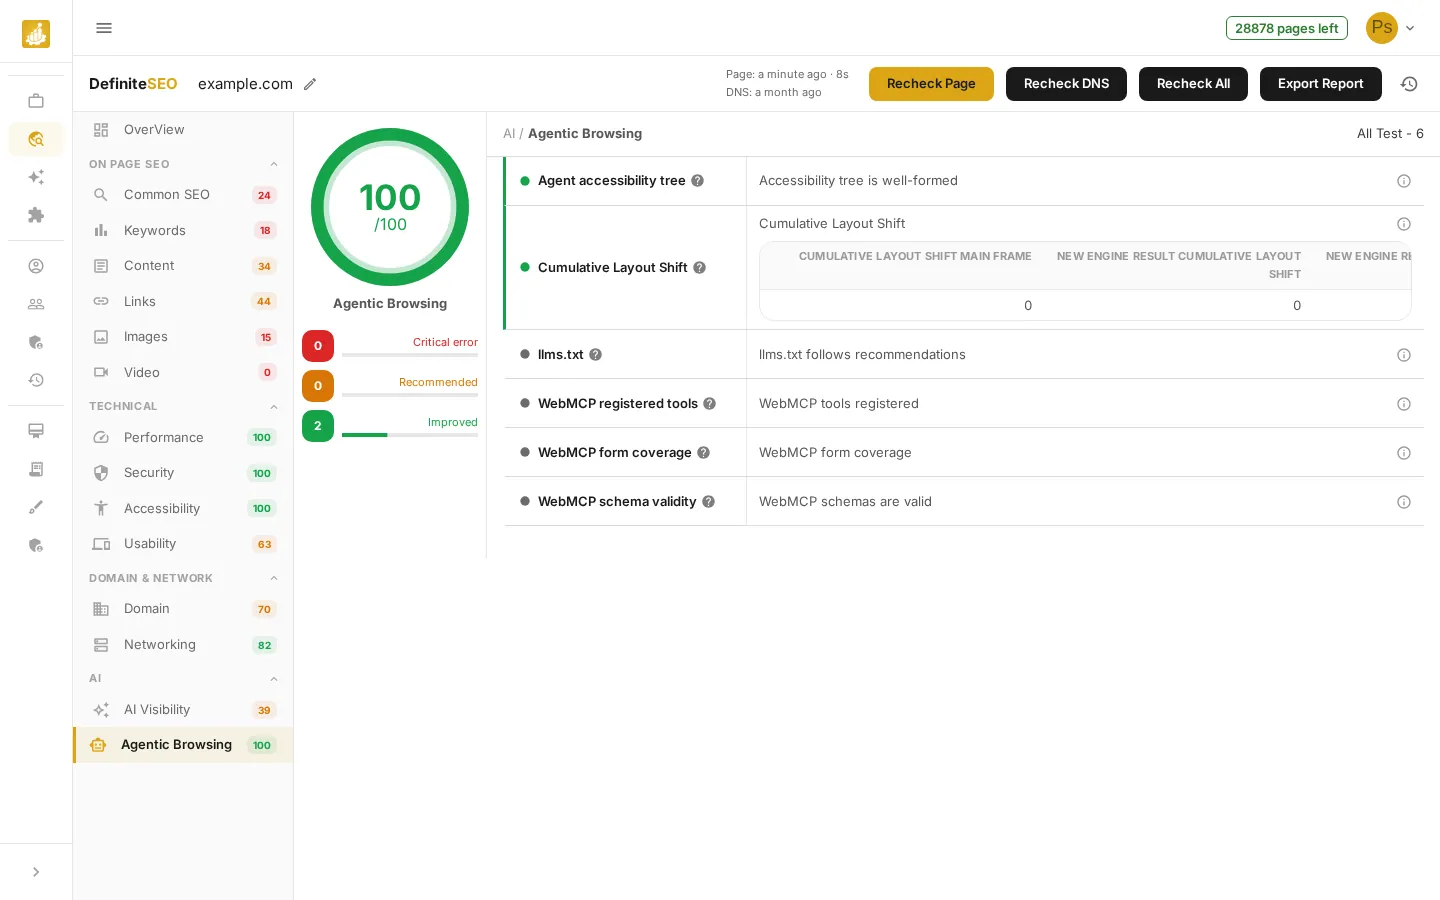
Click Agentic Browsing to see how well AI agents can navigate and act on your page. This is a growing factor as assistants start completing tasks on the web. Its checks cover the accessibility tree agents read, your llms.txt, WebMCP tool/form/schema support, and layout stability. Unlike AI Visibility, this section does count toward your overall SEO score.
- Agent Accessibility Tree: AI agents read your page through its accessibility tree. This checks interactive elements have clear names and valid roles so agents can act reliably.
- Cumulative Layout Shift: A stable layout matters for agents too: elements that move after load can make an agent act on the wrong target. The row expands into a small table of layout-shift values per frame.
- llms.txt: Looks for an llms.txt file, which lets you give AI agents curated, machine-readable guidance about your most important pages.
- WebMCP Registered Tools: WebMCP is a standard that lets your page expose defined commands (tools) an agent can call. This reports the tools your page registers.
See 2 more checks
- WebMCP Form Coverage: Checks how much of your form functionality is exposed through WebMCP, so agents can complete forms through a defined interface.
- WebMCP Schema Validity: Validates that your WebMCP tool definitions are well-formed, so agents can call them without errors.
Save, share, or re-run your report
Your report toolbar stays available as you work. Click Recheck Page, Recheck DNS, or Recheck All to re-scan on demand, or click Export Report to open the export dialog. From there you can Download HTML, Copy shareable link, or Send to Email. Returning to OverView shows the refreshed scores after any recheck.
- Download HTML: Generates a self-contained HTML copy of the report and saves it to your downloads, branded with your white-label logo and colors when configured.
- Copy shareable link: Copies a public /seo-report link to your clipboard that anyone can open to view this report, no login required.
- Send to Email: Asks for an email address and sends a link to the report straight to that inbox.
- Recheck after changes: Use Recheck Page after publishing content or speed fixes; the toolbar timestamps update to show the new scan age and the scores refresh in place.
📝 Note These options appear when you are signed in. Guests can run a scan but need a free account to recheck, export, or share reports. Which export options show can also depend on your plan and role (export and send-report permissions).